The stock market is a device for transferring money from the impatient to the patient. —Warren Buffett
As coronavirus and recession fears grip the stock market, don’t panic. Panic is never a good strategy.
Many people miss out on huge stock market moves because of fear. Then, they beat themselves up and make a promise to buy on a pullback.
The thing is, when the pullbacks eventually come, most will freeze. And that, folks, is a recipe for disaster.
I’ve seen it time and time again—like clockwork.
Mark Twain famously said that “history doesn’t repeat itself, but it often rhymes.” My data tells me the same… As markets are in free fall right now, the big money is rushing out of stocks.
That’s how supply and demand works.
The key for me has always been to remove emotion from the equation and look at data. Data can tell you a lot more than panic ever will.
Instead of rushing to the exit, look at the data and make a plan.
Because right now, we’re edging ever closer to a great buying opportunity…
This green signal has guided me in the past
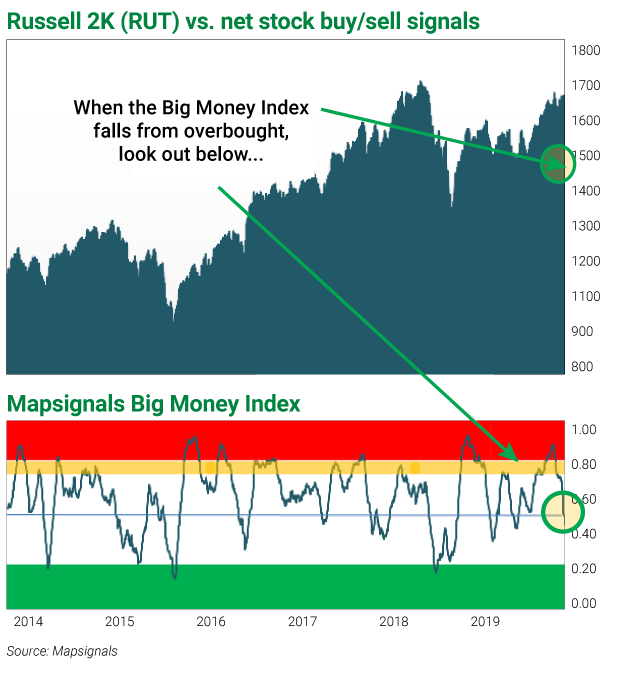
Below, you can see the Big Money Index (BMI), a proprietary index that measures big money activity (think large hedge funds) on thousands of stocks, with a few price relationships. (The Russell 2000 Index, the benchmark for 2000 small-cap stocks, is highly correlated to the BMI.)
If the BMI is going up, big money buying is increasing. If it’s going down, the big money selling is increasing.
In January and February, it was signaling that stocks were extremely overbought.
I wasn’t interested in buying up there. But something changed in late January—the index began to fall.
That means selling is picking up and buying is slowing.
Bottom line: When the Big Money Index is falling, look out below.

In the chart above, you can see an area in red and one in green. Once the index reaches the green area, it’s often a fabulous time to go shopping for great stocks.
Today, the BMI is indicating another two weeks before those levels can be triggered.
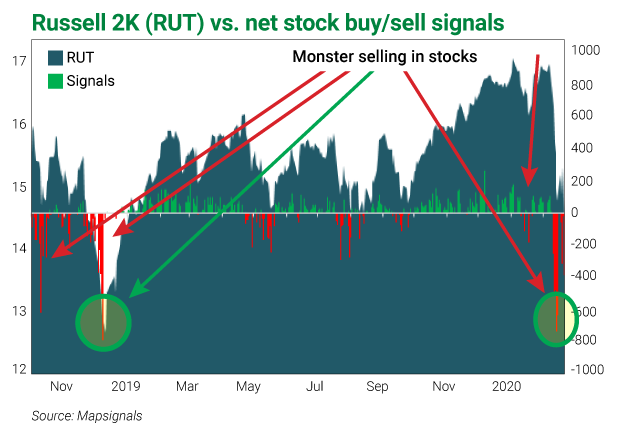
Let’s zoom in and look at the net buys and sells in stocks. Green bars mean net buys, and red bars means net sells.
We’re seeing monster selling in stocks.

So, what can we expect once we hit oversold?
The last three times this rare signal was triggered were December 24, 2018… October 25, 2018… and February 2, 2016… so, yeah, it’s super rare.
The average one-year return for benchmark SPDR S&P 500 ETF (SPY) after these signals is over 25%.
Just imagine if you had bought amazing stocks during those periods.
I’m talking about companies that have wide moats and are super profitable.
Those are the ones that are going to bounce massively once the sellers are done.
Some of my best buys ever were made during those periods.
I’ll be doing the same once that signal triggers again… like clockwork.
Editor’s Note: Frank recently released a special report breaking down how the coronavirus will impact the global economy… the names and sectors to avoid… and his two favorite strategies to protect yourself AND profit during one of the most volatile periods in market history. Learn how to access it here.


