The summer is here. For kids and parents, that means fun in the sun, ice cream, and no school…
But for investors, it means buckling up and preparing for bumpy markets.
If you’ve been investing for a while, you know summer months typically bring lower liquidity—and higher volatility—in the stock market.
There’s a simple reason for this: Wall Street professionals are away on vacation. And they usually close out any big positions ahead of time… so they can relax.
And the fewer buyers in markets, the more volatile stocks tend to be.
My favorite indicator is flashing a warning sign that stock buyers are disappearing fast. In fact, it’s sitting at levels not seen since October.
I’ll show you what I mean… and tell you what it implies for stocks going forward. Then I’ll give you an ETF to play this setup.
The BMI is flashing a warning sign
I look at Big Money data every day. It’s my morning newspaper. I use it to help me make sense of the stock market.
Tracking the Big Money allows me to see under the surface of the market. It measures the buying and selling in thousands of stocks. Usually, the data is pretty unexciting. But recently, the data shows a big increase in selling…
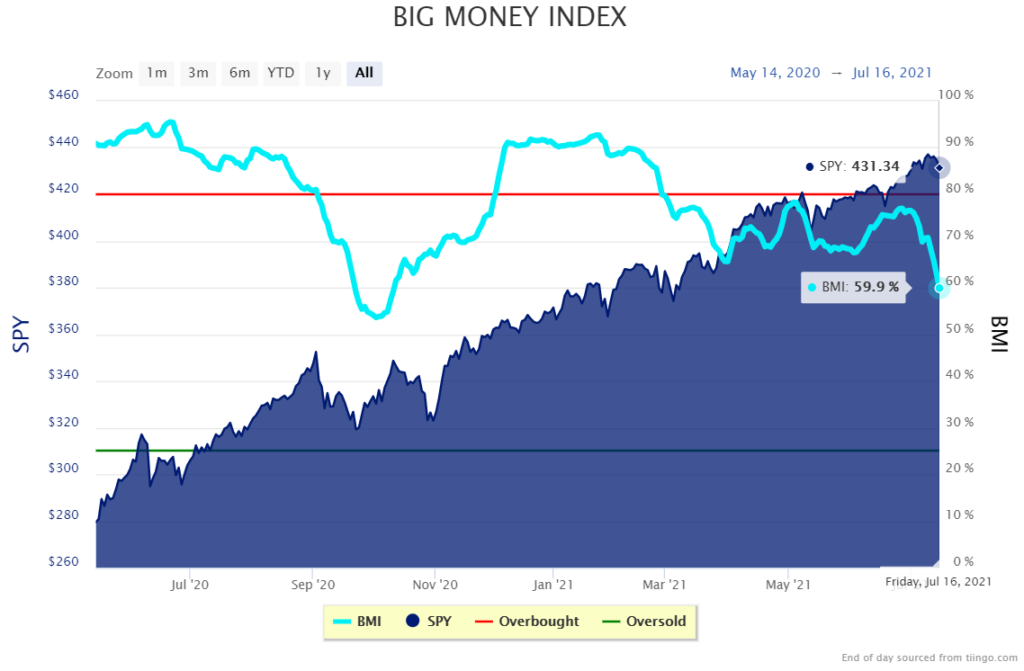
Below is the Big Money Index (BMI). It tracks buying and selling in stocks—combining all the action into a single blue line we can focus on. When the blue line rises, it means stocks are getting bought. That’s generally a bullish sign.
But recently the index has been falling in dramatic fashion. That means selling is picking up rapidly. Have a look:

As you can see on the far right of the chart, the BMI has been falling fast for nearly two weeks… while the S&P 500 has traded sideways.
The BMI is important because it tends to move ahead of the market.
For example, the current action reminds me of September 2020, which you can also see in the chart. If you look closely, you’ll notice the BMI began falling well in advance of the big selloff during the 2020 election season.
Now, let’s check the Big Money Stock Buys & Sells chart. It gives us another way of looking at the daily buying and selling in stocks.
In short, green bars indicate buyers and red bars are sellers. The Y-axis shows the daily totals of stocks getting bought and sold. Look how selling has gained recently:

Notice the recent increase in red bars. Those are days when there were more stocks declining on big volume vs. rising.
For example, Friday had 120 “sells” vs only 20 “buys”… so the result for the day is -100. That’s the latest red stick on the chart (way off to the right). Those red sticks are what’s dragging on the BMI that we looked at in the first chart.
And since the BMI is falling so quickly, I expect more pain ahead for stocks in the near-term.
So, what’s an investor to do?
Rather than selling everything, the better strategy is to dial down your risk a bit during the summer months.
The easiest way to buy an entire basket of “safer” stocks is by buying the Invesco S&P 500 Low Volatility ETF (SPLV). It’s full of consumer staple stocks that tend to be less volatile… thus the name.
It holds household companies like Colgate-Palmolive (CL), Procter & Gamble (PG), and PepsiCo (PEP).
But this fund isn’t just about hiding from volatility. It’s also one of the few areas in the market seeing buyers…
Below is the Big Money chart for SPLV. The recent green bars are showing Big Money buy signals:

Those green bars tell us that SPLV rose on outsized trading volume. In other words, each green bar is a sign that big institutions were scooping up shares.
Here’s the bottom line: Summer is here and it’s a time when volatility usually ramps up. The BMI is flashing a warning for stocks in the near-term, which means it’s a good time to get defensive.
Meanwhile, one of the few bright areas—in terms of Big Money buying—is SPLV.
It’s my favorite fund to ride out the volatile summer months.
P.S. Thanks to those of you who’ve written in with your “Nest Egg” investment stories. I’ve gotten some fantastic feedback I can’t wait to share in an upcoming letter…
What are your investing goals… your biggest achievements… the most valuable lessons you’ve learned in the markets?
Tell us your stories with the subject line “Nest Egg.”


