This week, the Fed hiked interest rates by 0.25%—the first rate hike since 2018… and the minimum possible rate hike central bankers could have implemented.
It’s nowhere near enough to make a dent in current inflation, which is at a multi-decade high.
There are now multiple indications that the U.S. consumer, the bond market, and even equity investors have their doubts about the Fed’s ability to control inflation… short of sending the economy into recession. In fact, a bond market signal is calling for extreme caution…
Yet, the market rallied this week… including the 4.4% rally Tuesday through Wednesday.
Today, I’m going to show you how to profit from this contradiction.
The market is loving these pleasant surprises
The three most recent similar-sized rallies happened in late March and April 2020… and in December 2018.
All three were associated with the Fed cutting—not hiking—rates.
This week’s action, therefore, tells us the market was pleasantly surprised by the Fed going for the smallest hike possible (0.25% vs. a more aggressive 0.5%).
Another pleasant surprise: Quantitative tightening to reduce the Fed’s record balance sheet is being pushed to May at the earliest.
Remember: In addition to using zero interest rates… the Fed has also been buying bonds over the last two years to stimulate the economy during the pandemic. This has stretched its balance sheet to previously unimaginable levels.
The unprecedented quantitative easing made sense as the worst of the COVID crisis threatened to shut down the entire financial system. But now, COVID is largely behind us… the Fed’s balance sheet sits at a staggering $8.9 trillion… and inflation is at an unbelievable 7.8% (as you can see on the chart below).
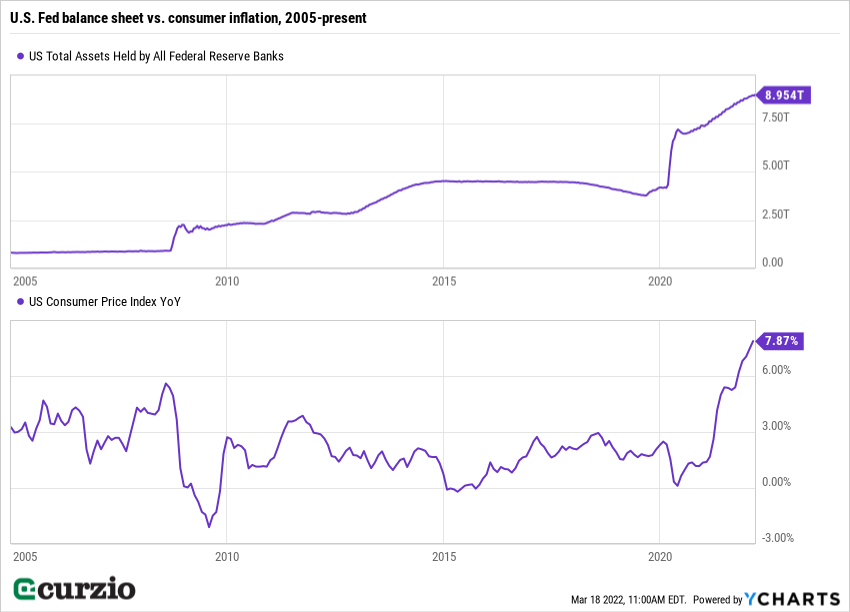
The market loves free money—and plenty of it. So the longer it takes for the Fed to unravel its balance sheet… the better for the market (but the worse for inflation).
Plus, the equity market doesn’t seem to be buying the Fed’s stated plans to hike rates six more times this year (at every remaining meeting of 2022). By rallying this week (albeit from oversold levels), stocks are betting the Fed will blink first… and won’t raise rates nearly as much as it says it will.
On the other hand, bonds are telling a totally different story… as one important economic indicator flashes red for the first time since 2020.
The bond market says a recession is around the corner
The yield curve is the difference between yields on equal-quality bonds (i.e. U.S. Treasurys) of different maturities.
And its slope is a valid, time-tested indicator of economic activity and outlook…
If the yield curve is sloped upwards, it means investors are demanding higher yields from longer-dated securities.
That’s totally normal… and a good sign for the stability of the economy.
After all, when you lend your money for a longer period of time (say, for 10 years vs. a couple of years), your risk is higher, and you’re separated from your money for longer… So naturally, you demand higher pay in the form of a higher yield.
Another way to express the shape of the yield curve is to look at the difference (spread) between bonds of varying maturities.
As you can see from the chart below, the 2-year rate is normally much lower than the 7- or 10-year rates (the spread is wide).
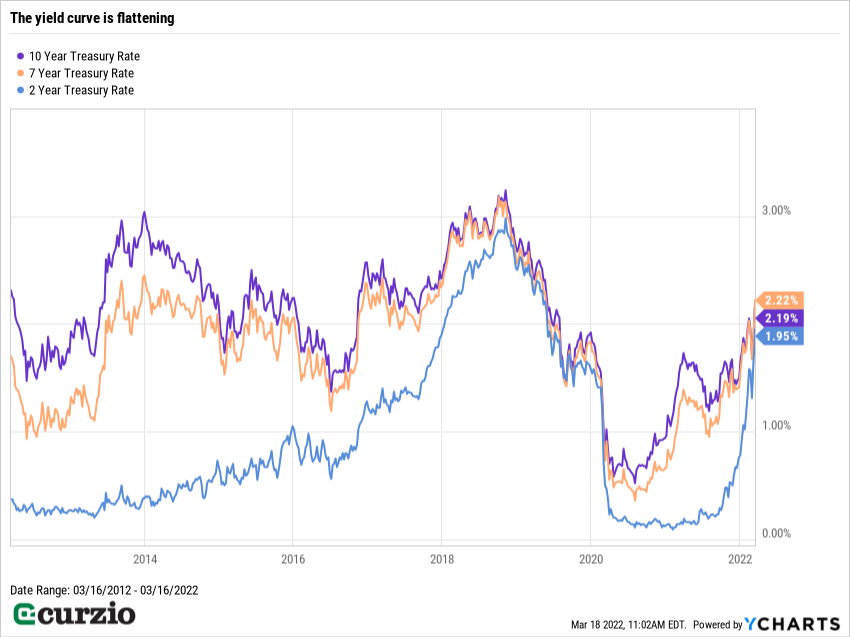
On the other hand, when the market doesn’t expect the economy to stay steady or improve, investors tend to anticipate lower yields far out in the future… This results in the longer-dated yields being comparable with shorter-term yields (a flat curve).
Worse yet, when investors demand higher rates in the nearest term, the yield curve inverts. The yields on shorter- and longer-dated Treasurys became very close. Such inversion is considered a bad omen for the economy… and often precedes recessions.
In the chart above, you can see two instances over the past decade when the yield curve got flatter and flatter (almost no difference between longer-dated and shorter-term bonds)…. First, in late 2018, when the Fed cut rates because the market and the economy were tottering, the curve began to flatten dramatically. And it flattened in early 2020… as the economy went into recession.
As you can see… the only other time we’ve seen conditions like this is today. The three lines have converged… and the yield curve even inverted immediately after the Fed’s meeting. (The chart shows the 10-year Treasury now yields less than the 7-year… a picture-perfect image of inversion.)
How to profit from these diverging indicators
The yield curve has been screaming “recession” while the equity markets have been more upbeat.
What are investors to do?
For one, prepare for higher inflation. If the economy keeps slowing, the Fed will have no choice but to put its rate-hiking plan on pause. And even if it stays on the case, its current rate increase plans won’t do much to bring this red-hot inflation down.
While it’s hard to beat inflation… it’s even harder if you don’t own any equities. Buy quality stocks and don’t forget about dividends. Even if you don’t profit immediately—especially considering the likely scenario of market weakness—you’ll be much better off in the long term.
You could also consider a couple of inverse ETFs or put options. These will benefit directly from a declining market… and help you weather the volatility.
The war in Ukraine, too, has changed the macro calculus… But this is a separate subject for another day.
For now, remember to exercise caution. Own a few inverse ETFs or puts to benefit from the declining market… and don’t shun high-quality dividend-growth equities that will set you up for long-term profits.
P.S. We’re living in unprecedented times.
A Russian invasion… runaway inflation… out-of-control oil prices…
It’s important to protect your portfolio right now… But that doesn’t mean you can’t find ways to profit, too.


