With only one quarter left in the year, 2023 is already headed for history books.
Despite the Fed’s aggressive rate-hiking campaign, the economy is holding on (so far). And even after a two-month pullback, the S&P 500 is showing a double-digit gain for the year.
Market optimists are taking this performance as a sign that a soft landing is in the cards.
But while the market might look strong on the surface, a closer look tells us the optimists’ outlook is built on a crumbling foundation… and the market could come crashing down at any moment.
Today, I’ll break down the alarming discrepancies amid the market’s 2023 gains… and how to profit when they inevitably reverse.
Let’s start with a look at the market’s supposedly “strong” performance so far this year…
The market’s overall performance hides an ugly picture
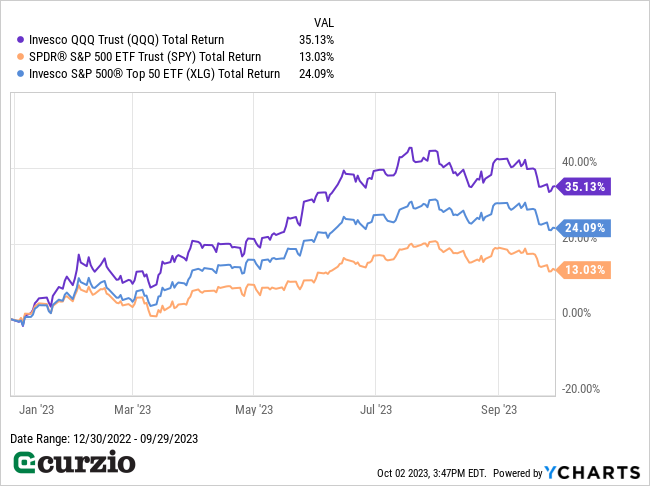
As you can see on the chart below, on the surface, the S&P 500 has been having a great year—up 13% so far… with the largest 50 stocks in the market faring particularly well (with gains of 24%).
Meanwhile, the tech-heavy Nasdaq—represented on the chart by the Invesco QQQ Trust (QQQ)—has been doing even better, soaring 35% since the start of 2023.

Great, right?
Not so fast…
You see, these data points hide a problematic issue…
The entire market’s performance has been propped up by the most powerful mega-cap tech stocks—like Apple (AAPL), Microsoft (MSFT), Nvidia (NVDA), and Alphabet (GOOG).
Meanwhile, the rest of the market has been marching in place.
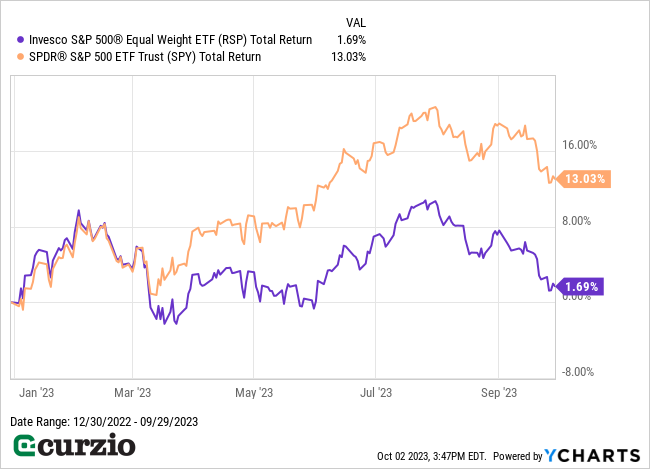
You can see this fact illustrated on the next chart—where I’ve tracked the performance of the S&P 500 (which is weighted by market cap) vs. the Invesco S&P 500 Equal Weight ETF (RSP). This ETF’s name says it all: It gives equal weight to every stock in the S&P 500.
As we saw above, the market-cap-weighted market index is up 13%… while the equal-weighted version is up just 1.7%.

In other words, the strength in the market’s largest stocks is hiding a much uglier picture.
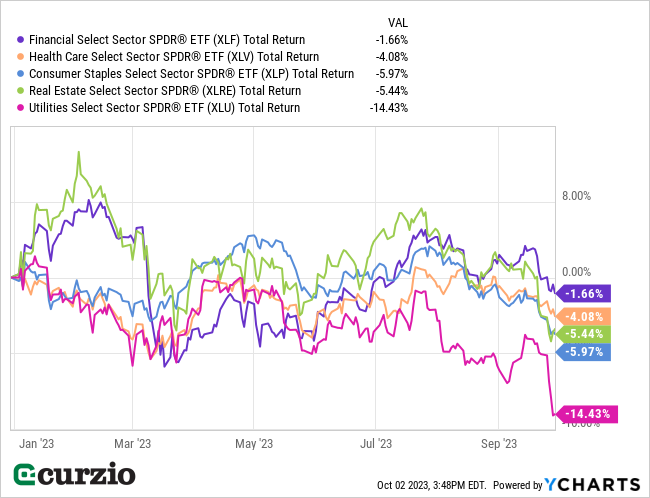
And when you look at the sectors most heavily dependent on the debt market (and therefore most sensitive to rising interest rates)… the situation looks even bleaker.
Financials, healthcare, real estate, consumer staples, and especially utilities are all down significantly, as you can see below.

But if mega-caps are leading the market higher, why does the weaker action in these other sectors matter?
For one, these non-tech sectors are telling us the economy is in much worse condition than the market indicates.
For another, one sector can’t keep rising forever while the rest of the market keeps sinking.
Eventually, something has to give. Either these flailing sectors will rally… or the entire market will fall.
And the latter outcome is much more likely. The suffering sectors are already telling us they have no profit potential thanks to the Fed’s higher interest rates. Put simply: They’re not going to rally anytime soon.
That means mega-caps are bound to join the decline—and when they do, they’ll bring down the entire market.
And that’s why, more than ever, investors need to protect themselves from a big, market-wide decline.
Fortunately, there’s a simple way to do it…
Put options—especially long-dated ones that won’t expire for several months—are an easy way for investors to buy “insurance” against plunging stock prices. They’re also a great way to generate profits when the market (or a specific sector) declines sharply.
During the bear market of 2022, my Moneyflow Trader portfolio used long-dated puts to lock in gains as high as 271%.
The bottom line: This year’s market action is much less bullish than the headlines (and major indices) would have you believe. Half the market is flashing a major warning sign that the Fed has overdone its rate hikes… and a market crash is on the horizon.
Don’t ignore this warning.
Use strategic put options to protect your stock market gains—and profit big when the worst-case scenario plays out.


