Markets ebb and flow. That’s what they do.
But as I’ll show you today, rarely do we see selling in stocks like we’ve seen recently.
Investors are wondering what’s next for the market… and when it will be time to buy.
Over the last few weeks, I’ve written about the signals and opportunities I’m watching for in today’s oversold market… but we’re not in the clear yet.
Selling needs to exhaust itself—forming a bottom—before buyers can lead the way.
There are things to watch out for when a bottom is being formed… such as extreme negative sentiment and less forced selling of stocks.
And today, forced selling appears to be in the rear-view mirror.
But before we look at how selling is slowing, let’s look at where the Big Money Index (BMI) sits…
The BMI is a proprietary index that tracks money moving in and out of thousands of stocks each day. Right now, it shows that the market is extremely oversold.
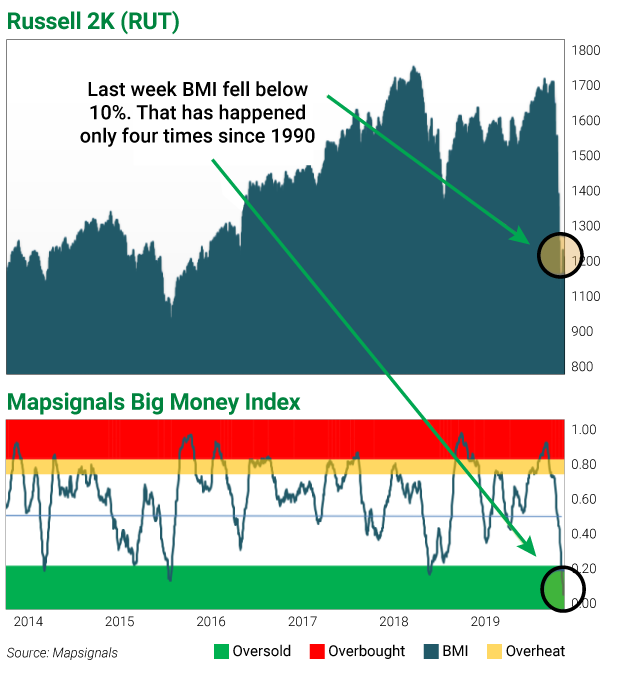
We’re deeply in the green, which usually predicts higher prices in the weeks and months ahead.
The thing is—we can stay oversold for a long time. What’s key is to follow the flow of big money…
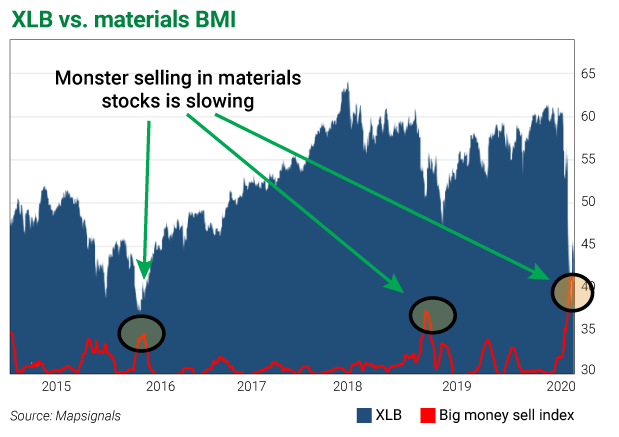
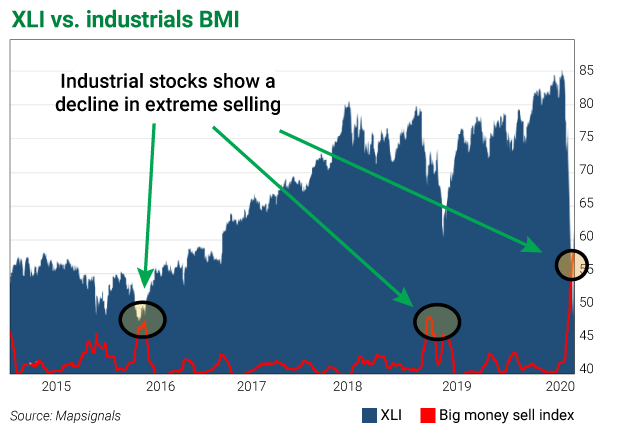
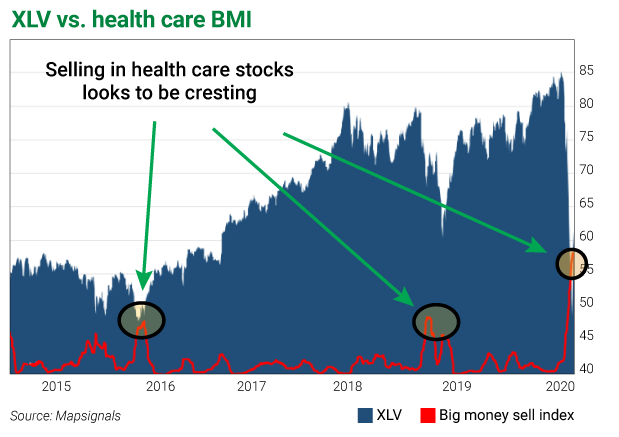
To do this, I group stock sells by sector and use a moving average to look at the velocity of selling.
If this indicator—the red line in the charts below—is increasing, selling is increasing rapidly. If it’s decreasing, selling is slowing.
When I pop the hood on the market internals—I see the rate of selling slowing. The red line is starting to fall.
Check the materials sector:
Now industrials:
Now health care:
Lastly, here’s technology:
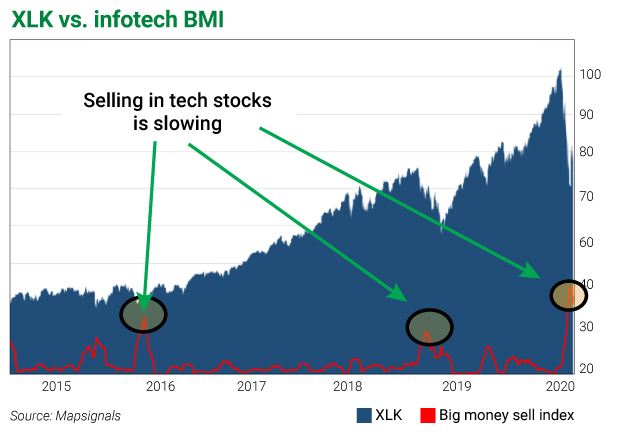
Clearly, you can see what I’m seeing. And at the very least it’s a positive data point in the sea of red out there.
What’s next for the market?
This is the million-dollar question. So I turned to my data…
I looked back in history for times when we’ve been extremely oversold—similar to now.
Last week, our BMI fell below 10%. That means that for over 25 days, buyers were basically non-existent. Sellers are in control.
And this amount of selling is incredibly rare.
We’ve seen it only three times since 1990.
The last time was during the global financial crisis—a terribly dark period for the market. And today’s market action has many parallels.
So, what can we expect going forward with selling of this magnitude?
Have a look:
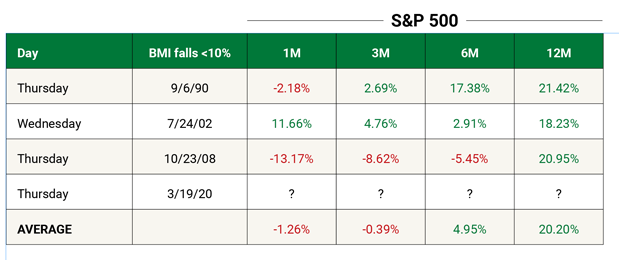
The returns for one to three months is rather unimpressive… and slants negative.
But if you look out to 12 months, the average gains for the S&P 500 are over 20%.
That gets me excited—it gives me hope.
Look, there’s plenty of negativity in the world right now, and I choose to look for the light at the end of the tunnel.
For me, it’s more productive. I firmly believe the world will be in a better place a year from now.
If we can make it out of the 2008–2009 debacle, we’ll make it out of the coronavirus situation, too.
Hang in there and don’t give up. 30 years of history says the market will bounce back… and the economy with it.
Editor’s note: If, like many investors, you weren’t prepared to take advantage of the historic 2008–2009 buying opportunity, you’re about to have another chance…
A record stimulus and zero-interest policy mean investors could make a fortune in the coming months… but you have to prepare now.
Fortunately, Frank has put together a brief video explaining how to get started.

