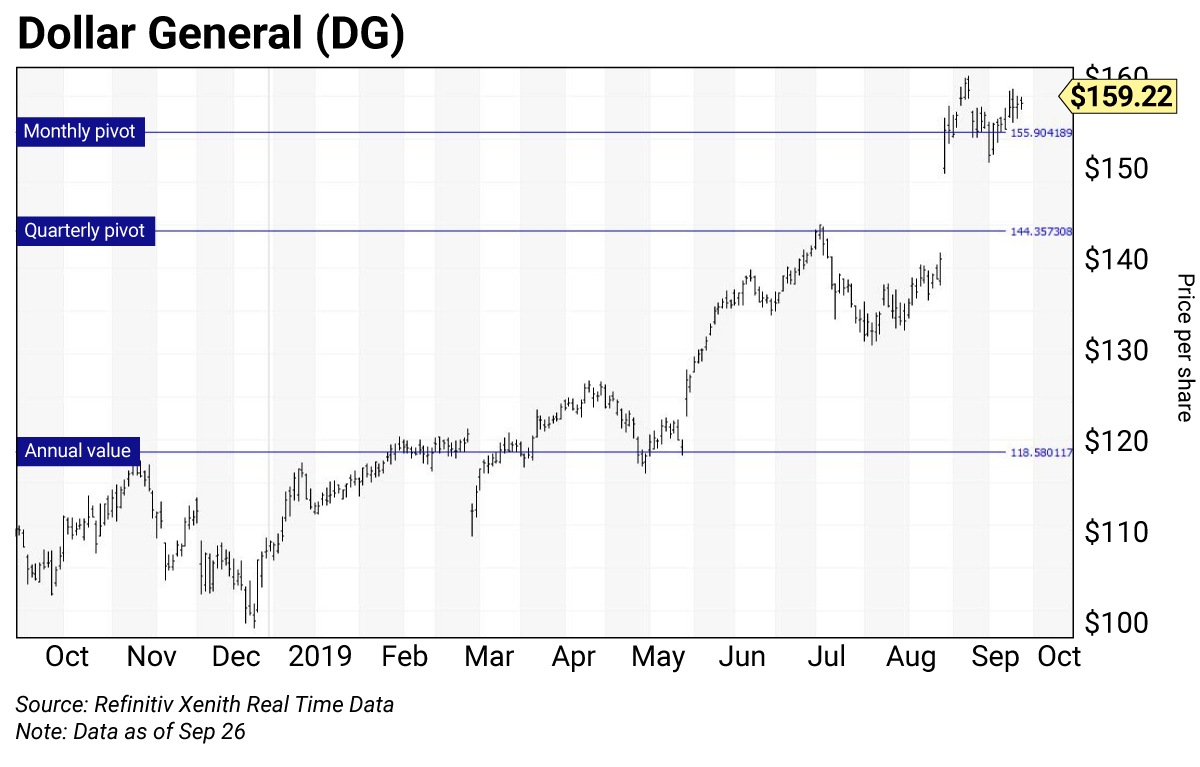
Dollar General (DG) has had a great run this year… setting an all-time intraday high on September 9.
The company has 15,000 variety stores across the continental U.S. It’s in expansion mode… with new stores under construction in Wyoming and Washington State. This would place Dollar General locations in 46 states.
The stores are typically in rural communities where consumers live paycheck to paycheck, and it appears that paychecks have been higher… On August 29, the company reported better-than-expected earnings and an increase in same-stores sales. This caused a price gap higher on the daily chart… continuing to that all-time intraday high of $162.34 on September 9.

As a result, the stock is no longer cheap… It’s overvalued fundamentally and overbought technically—a combination that means it’s time to book profits…
I’ve been bullish on Dollar General since the stock stabilized above its annual value level at $118.55 on February 13.
- Pivot (monthly): $155.90
- Pivot (quarterly): $144.36
- Value (annual): $118.58
- Value (semiannual): $118.27 (not shown)
After a strong four-month run, shares of Dollar General are trading around $160. That puts the stock well above all four key levels shown above. (For details on how to use the trading levels, see the box below.)
The annual value level was a pivot point for the stock… and a magnet between February 13–May 29. Better-than-expected earnings on May 30 prompted the upside move.
The stock reached its current quarterly pivot at $144.36 on July 17, then consolidated somewhat. The monthly pivot at $155.90 formed as September began.
As you can see in the chart above, the stock climbed to new highs using the pivot levels as stairs. Now that the stock is above the top step, it’s time to book profits.
Not only are the technicals looking grim for Dollar General, I see cracks forming in the fundamentals.
Earlier this week, the latest consumer confidence data came in much worse than expected, falling to a reading of 125.1 (from 134.2 last month). This implies consumers are concerned about a potential slowdown in the economy and trade war tensions with China.
Shares of Dollar General are also expensive. They’re trading at an elevated price-to-earnings (P/E) ratio of 25.11. And with a dividend yield of just 0.81%, it’s not a stock for value investors.
Trading strategy
Reduce holdings on Dollar General (DG) above its monthly pivot at $155.90.
How to use trading levels
The trading levels on my charts pinpoint strategic buy and sell levels. They’re a great tool for maximizing gains and limiting losses on stocks you plan to hold long-term.
Value levels and risky levels are based upon the last nine monthly, quarterly, semiannual and annual closes. The first set of levels was based upon the market closes on December 31. The original annual level remains in play.
The monthly level changes at the end of each month, the latest on August 30. The quarterly level was changed at the end of June.
Value level: sits below where the stock is trading.
Pivot level: often sits right around where the stock is trading. A pivot level is a value level or risky level that was violated within its time horizon. Pivots act as magnets and have a high probability of being tested again before the time horizon expires.
Risky level: sits above where the stock is trading.
To capture share price volatility, investors should buy on weakness to a value level and reduce holdings on strength to a risky level.

 | Rich Suttmeier Founder & CEO, Global Market Consultants |


