“90% of life is showing up.” –Woody Allen
Just when things were starting to feel “safe” in the market, the sellers showed up…
Breathtaking rallies make investors cheerful. Good vibes lead to overexcitement… and then to fear of missing out (FOMO).
Here’s the rub: When everyone goes the same way, WATCH OUT.
I warned you about this three weeks ago, as we were seeing record-breaking stock and ETF buying. I explained why peaks often follow this type of insane buying… and why there was a high probability of a pullback.
Since I wrote that article, the S&P 500 (SPY) fell 6.75%.
Today, I’m going to show you what’s happening behind the scenes… and what you should do to take advantage of it.
For weeks, my data has revealed an exodus of Big Money buyers (institutional investors and market movers).
When these guys bail, lower markets follow…
The Big Money Index says markets will head lower
While many analysts focus on dozens of charts and indicators to determine the market’s direction, I stick to one indicator: the flow of Big Money. It hasn’t failed me yet…
Years of working on Wall Street taught me to respect money flows in stocks. And handling billions of dollars in trades (sometimes in a day) taught me firsthand to never fight the Big Money.
At my research company, Mapsignals, we spend all our time studying where the Big Money is headed.
And suddenly, our data says Big Money is selling.
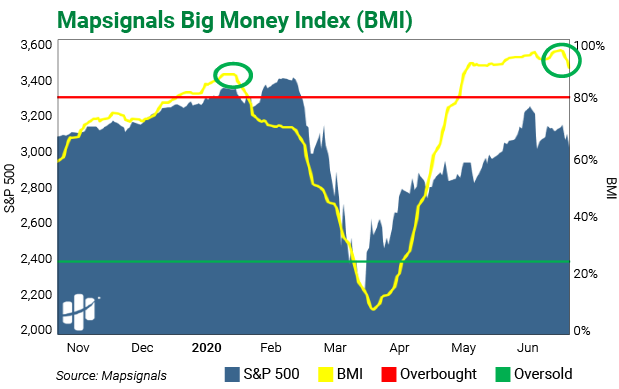
Below we see the Mapsignals Big Money Index (BMI). It’s a proprietary index of 1,500 stocks that measures the estimated trading of Big Money players. All major U.S. stock indices correlate to Big Money buying, but here I use the well-known S&P 500 as a benchmark.
If the BMI sits on or above the red line, then the market is overbought. We’ve been that way for a while.
The most important thing to focus on is when the BMI changes. If it’s suddenly going down, selling is picking up.
If “90% of life is showing up,” you could say the sellers just came to life… The BMI is starting to fall rapidly:
I’m not banging the bear drum. All this means is that markets will likely give back some of the massive recent gains. It’s normal.
And it’s also a good thing. As I told Frank in Wall Street Unplugged, volatility equals opportunity. You don’t want to buy stocks when everyone is competing for them. It’s better to grab them when they’re selling them!
But can we actually see the sellers showing up? Let’s take a look…
When the first red bars show up, expect selling to continue…
For patient investors, pullbacks offer great deals on some of the best stocks. And I believe a great buying opportunity is around the bend.
Below is a chart of Big Money stock buying. It’s our algorithmic assumption of money flows. A green bar means a net buy day, while a red bar means net sellers.
Weeks ago, we saw record-breaking buying (the big circle off to the right). When we’re overbought—as we are today—that’s a near-term bearish signal.
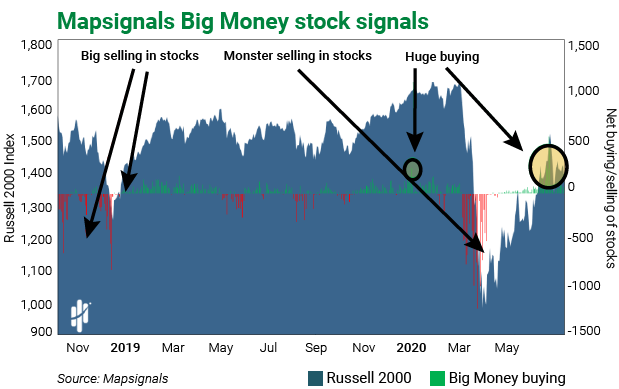
But, like I said last week, buying has been dramatically slowing. We’re seeing the first red days—which represent selling—in nearly three months. Check it out:
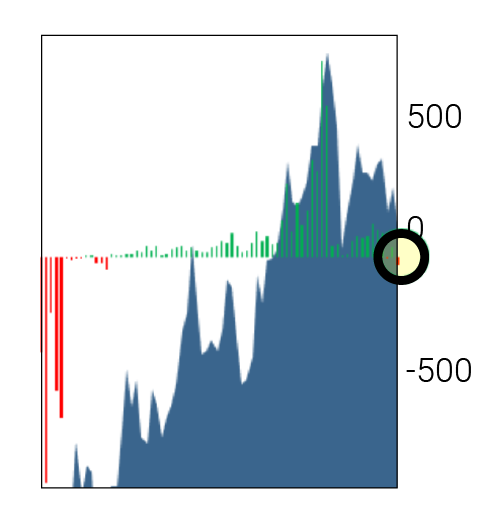
Sellers have finally wrestled control from the buyers. I expect that trend to continue in the near-term.
Big Money tends to forecast what’s to come. And following it has kept me ahead of the game.
The bottom line: Expect lower prices soon. Use this time to build a wish list of great stocks you want to own.
Then…
Be patient.
The sellers have shown up.
That’s the sound of opportunity knocking…
Editor’s note:Not sure which stocks should be on your “wish list” for the next buying opportunity? Check out Frank’s trial offer of Curzio Research Advisory. You’ll get immediate access to his exclusive COVID-19 report: How to prepare for what’s coming next—a detailed watch list of stocks that could see incredible gains from this new economy…


