

Important notice: We hate to say it, but today is the final issue of Chart of the Week. And Rich released it a day early to help you capture gains on AT&T before it continues its downtrend. The good news is, Rich is about to launch a brand-new weekly trading advisory. See below for details…
Sell AT&T (T) above $38. The stock closed over $38 yesterday, so you shouldn’t have a problem selling above this level.
Everyone has heard of AT&T. It’s one of the biggest companies in America… and has a history that stretches back into the 1800’s to inventor Alexander Graham Bell. It’s been a part of some of the biggest advances in telephone and radio since.
When I recommended buying AT&T on October 11, the stock had broken out to new highs, but pulled back to an attractive buy level. We had a positive chart.
My buy recommendation was based on AT&T’s potential to breakout again to the upside, partly due to financing talks that would relieve debt related to its 2015 purchase of DirecTV.
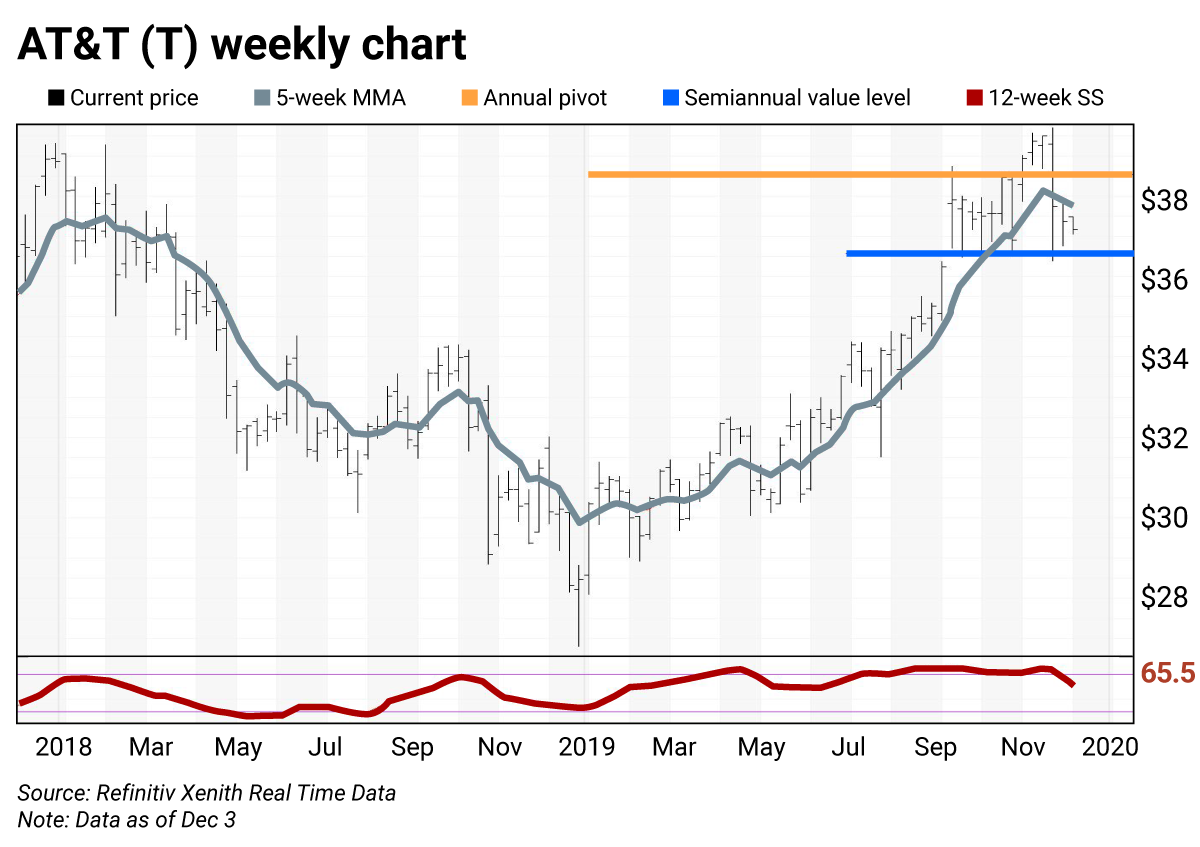
My system targeted a good buy range—between the semiannual pivot at $36.58 and the annual pivot at $38.53. (The first buy level was the October 11 open at $37.59.)
The trade went well at first. AT&T continued trending higher in early November. Its stock rose as high as $39.70 on November 18, after trading above its $38.53 annual pivot.
Unfortunately, this turned out to be a false rally. The stock fell back below $37 in late November. Even though it’s higher now, the downward move has triggered a sell signal from my system.
Based on the current price, readers who bought AT&T on my recommendation should be up 1-2% on their position.
But the important thing is this: When the chart turns negative, it’s time to sell.
In this week’s chart, you can see AT&T has been in an uptrend for almost all of 2019.
When I recommended buying the stock in October, we had a good entry point to capture the gains from a potential breakout to new highs.
But as I’ll explain, the chart has turned negative.
Why are we selling today?
My system is telling me there’s less chance for AT&T to make another move higher from here.
The recent pullback has pushed the stock below its five-week modified moving average (MMA). This indicator is the gray line on the chart, currently sitting at $37.75.
When a stock falls back below its five-week MMA, it’s a major red flag for my system. It signals that an uptrend is in danger of ending.
And that’s not the only signal that’s turning AT&T’s chart negative. The 12-week slow stochastic (SS) reading recently fell to around 65. It’s the red line at the bottom of the chart that moves between 0 and 100.
When trading in anticipation of a potential breakout higher, we don’t want to see a declining 12-week SS. We want to see this indicator continue rising. As you can see on the chart, it’s moved lower the past couple weeks.
Together, these “red flags” tell us it’s time to move to the sidelines on AT&T. The setup isn’t favorable anymore. We should focus our attention on better opportunities.
Trading Strategy: Sell AT&T above $38.00. This will give most readers a profit of about 1-2% at current prices, and also protect from further declines.
How to use trading levels
The trading levels on my charts pinpoint strategic buy and sell levels. They’re a great tool for maximizing gains and limiting losses on stocks you plan to hold long-term.
Value levels and risky levels are based upon the last nine monthly, quarterly, semiannual and annual closes. The first set of levels was based upon the market closes on December 31. The original annual level remains in play.
Value level: Sits below where the stock is trading.
Pivot level: Often sits right around where the stock is trading. A pivot level is a value level or risky level that was violated within its time horizon. Pivots act as magnets and have a high probability of being tested again before the time horizon expires.
Risky level: Sits above where the stock is trading.
To capture share price volatility, investors should buy on weakness to a value level and reduce holdings on strength to a risky level.

 | Rich Suttmeier Founder & CEO, Global Market Consultants |
Frank note: As many of you know, I’m super excited about the launch of Rich’s new trading service next week. We’re calling it 2-Second Trader, because it literally takes two seconds to use one of its key components—Rich’s Black Box trading machine. It’s based around a trading algorithm he perfected over three decades. Just plug in any stock trading on any major exchange… and this machine will tell you when to BUY or SELL it.
I believe it’s one of the most valuable tools on the market. And it could make you a killing…
To learn more, Click here to enter your email and I’ll send you the details as soon as they’re released.